Up: Stat 5102
Stat 5102 Final ExamMay 8, 2001
Name Student ID
Secret Code (if you want your final grade posted).
The exam is open book, including handouts. It is closed notes.
You may use one
 sheet of paper with formulas, etc.
You may use a calculator.
sheet of paper with formulas, etc.
You may use a calculator.
Put all of your work on this test form (use the back if necessary).
Show your work or give an explanation of your answer. No credit
for numbers with no indication of where they came from.
The points for the questions total to 200.
There are ![[*]](file:/usr/lib/latex2html/icons/crossref.png) pages
and 8 problems.
pages
and 8 problems.
- [25 pts.]
Suppose
 ,
,  ,
,  ,
,  are i. i. d.
 random variables, where
 is an unknown parameter. That is the
 are
are
 with
with
 .
Find a method of moments estimator of
.
Find a method of moments estimator of  .
.
- [25 pts.]
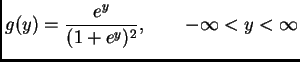
The function
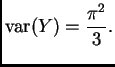
is a probability density, which is symmetric about zero and has variance
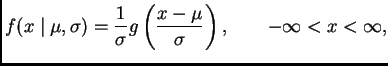
Suppose , , , are i. i. d. random variables with density
where
 is defined above.
What is the asymptotic efficiency of the sample median relative
to the sample mean as estimators of
is defined above.
What is the asymptotic efficiency of the sample median relative
to the sample mean as estimators of  ?
?
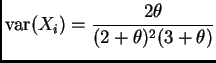
- [25 pts.]
Suppose , , , are i. i. d. random variables
having mean
and variance
and, as usual,
 denotes the sample mean.
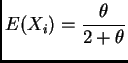
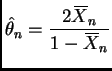
A method of moments estimator of is
What is
the asymptotic distribution of this estimator?
You must give the parameters of the asymptotic distribution as functions
of for full credit.
denotes the sample mean.
A method of moments estimator of is
What is
the asymptotic distribution of this estimator?
You must give the parameters of the asymptotic distribution as functions
of for full credit.
- [25 pts.]
Suppose
 and
and  are independent Poisson random variables with
means
are independent Poisson random variables with
means  and
and  , respectively. Suppose we observe
  and
and  . Find an asymptotic (large sample) 95% confidence interval
for
. Find an asymptotic (large sample) 95% confidence interval
for
 .
.
- [25 pts.]
Suppose , , , are i. i. d.
 random
 variables. Find the observed and expected Fisher information for
estimating .
random
random variables. Find the observed and expected Fisher information for
estimating .
- [25 pts.]
Suppose , , , are i. i. d. type II geometric distribution
random variables having density
(Section B.1.8 of the appendices to the notes)
and we want to do a Bayesian analysis with
a
 prior distribution for
  .
.
-
Find the posterior distribution for , giving it either as a
normalized probability density function or as a named distribution
with specified values of the hyperparameters.
- Find the posterior mean of .
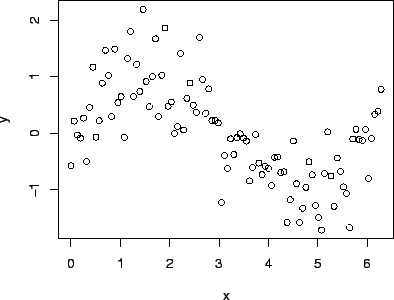
- [25 pts.]
Several models were fitted to the data for which the scatter plot is
shown below.
The output of the R anova command was
Analysis of Variance Table

Model 1: y ~ x
Model 2: y ~ x + I(x^2)
Model 3: y ~ x + I(x^2) + I(x^3)
Model 4: y ~ x + I(x^2) + I(x^3) + I(x^4)
Model 5: y ~ x + I(x^2) + I(x^3) + I(x^4) + I(x^5)
  Res.Df    RSS Df Sum of Sq        F Pr(>F)
1     98 48.906
2     97 48.851  1     0.054   0.2189 0.6410
3     96 23.442  1    25.410 102.1661 <2e-16 ***
4     95 23.439  1     0.003   0.0109 0.9170
5     94 23.379  1     0.060   0.2428 0.6233
---
Signif. codes:  0  `***'  0.001  `**'  0.01  `*'  0.05  `.'  0.1  ` '  1
- Explain what models are involved in the ANOVA table printout.
- Explain why these are nested models.
- Explain what conclusions about the fit of these models can be drawn
from the printout. Say which models appear to be correct (contain the true
regression function) and which appear to be incorrect (do not contain the
true regression function).
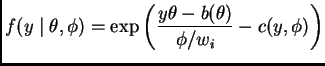
- [25 pts.]
Show that the type I geometric distribution with density
has the form of a GLM model given by equation (12.78) in the notes,
which is repeated below
Indicate clearly in your answer
- The canonical parameter .
- The dispersion parameter
 .
.
- The weight
 .
.
- The function
 .
.
Up: Stat 5102
Charles Geyer
2001-05-10